
A report created by the PennEnvironment Research & Policy Center and Frontier Group
DOWNLOAD THE FULL REPORTDOWNLOAD A FACTSHEET
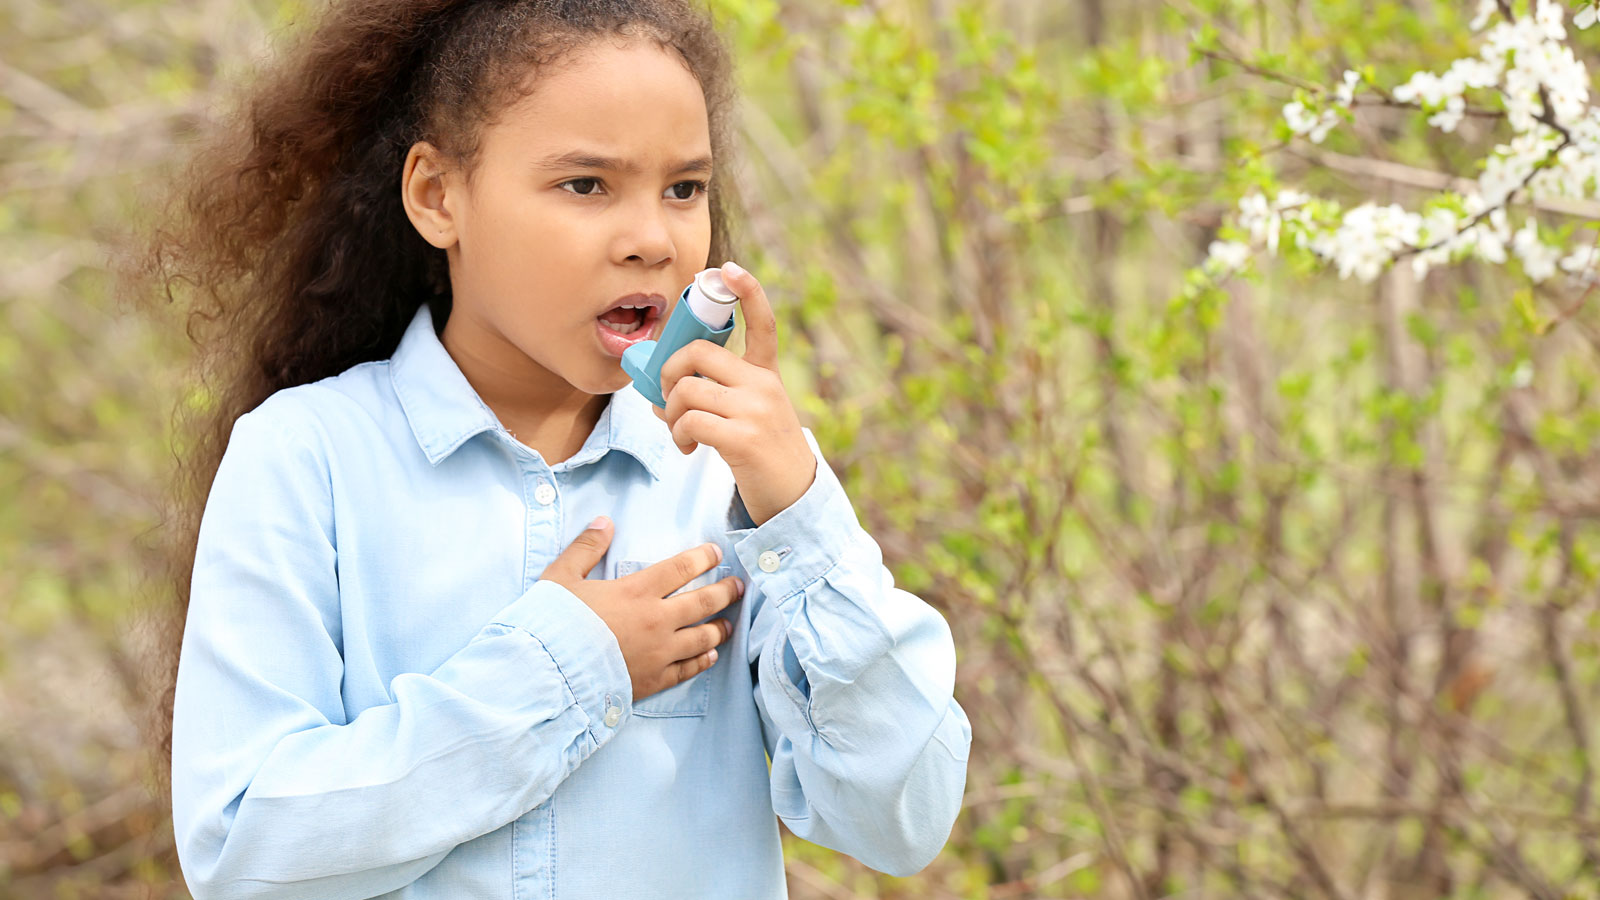
We should all be able to breathe clean air. It’s true that the days of thick smog making it difficult to see horizons in the distance or city skylines even a few blocks away are largely behind us. But people across Pennsylvania still regularly breathe dirty air that increases their risk of premature death and can trigger asthma and other adverse health effects.
Sadly, our report shows that the air in many Pennsylvania communities is probably not as clean as you might think. In 2018, 11 million Pennsylvanians lived in areas that experienced unhealthy air quality for at least 1 in 4 days in which ground-level ozone (the main ingredient in smog) or particulate pollution was above the level that the EPA has determined puts our health at risk.
These unhealthy air days put Pennsylvanians in cities, suburban areas, and rural areas, at risk. At the same time, our study shows that millions more Americans across the country are exposed to damaging levels of air pollution.
Each year, millions of Pennsylvanians suffer from adverse health impacts linked to air pollution, and tens of thousands have their lives cut short:
• Air pollution from sources such as vehicles and power plants was responsible for an estimated 4,800 premature deaths in 2018 in Pennsylvania alone1
• Air pollution is linked to health problems including respiratory illness, heart attack, stroke, cancer and mental health problems. Research continues to reveal new health impacts. For example, maternal exposure to air pollution such as fine particulates (PM2.5) and ozone is associated with a higher risk of low birth weight, pre-term birth and stillbirth.2 For older adults, long-term exposure to particulate pollution has been associated with an increased risk of Alzheimer’s disease and other forms of dementia.3
• Air pollution’s effects are pronounced among vulnerable populations, including children, pregnant women and the elderly. Research has found that children exposed to particulate pollution can suffer from lung development problems and long-term harm to lung function.4
• Levels of air pollution that meet current federal air quality standards can be harmful to health, especially with prolonged exposure. Researchers can detect negative health impacts, such as increased premature deaths, for people exposed to pollution at levels the EPA considers “good” or “moderate.”5 Current federal standards are less stringent than those recommended by the World Health Organization.6 Moreover, the EPA cautions that unusually sensitive people may experience health effects at “moderate” levels. For these reasons, the analysis in this report includes air pollution at or above the level the EPA labels “moderate,” corresponding with a rating yellow or higher in its Air Quality Index.
The U.S. Global Change Research Program’s Fourth National Climate Assessment warns that unless the nation acts to improve air quality, “climate change will worsen existing air pollution levels. This worsened air pollution would increase the incidence of adverse respiratory and cardiovascular health effects, including premature death.”7
Climate change will worsen air pollution in several ways, including:
• Rising temperatures will speed up the formation of ozone. According to one study, people in the Northeast, Midwest and Southwest will experience three to nine more days of ozone pollution at or above the level the U.S. EPA considers “unhealthy for sensitive groups” annually by 2050 compared to 2000 because of higher temperatures.8
• More frequent and intense storms will cause increasingly severe flooding and wash away roads and hillsides.
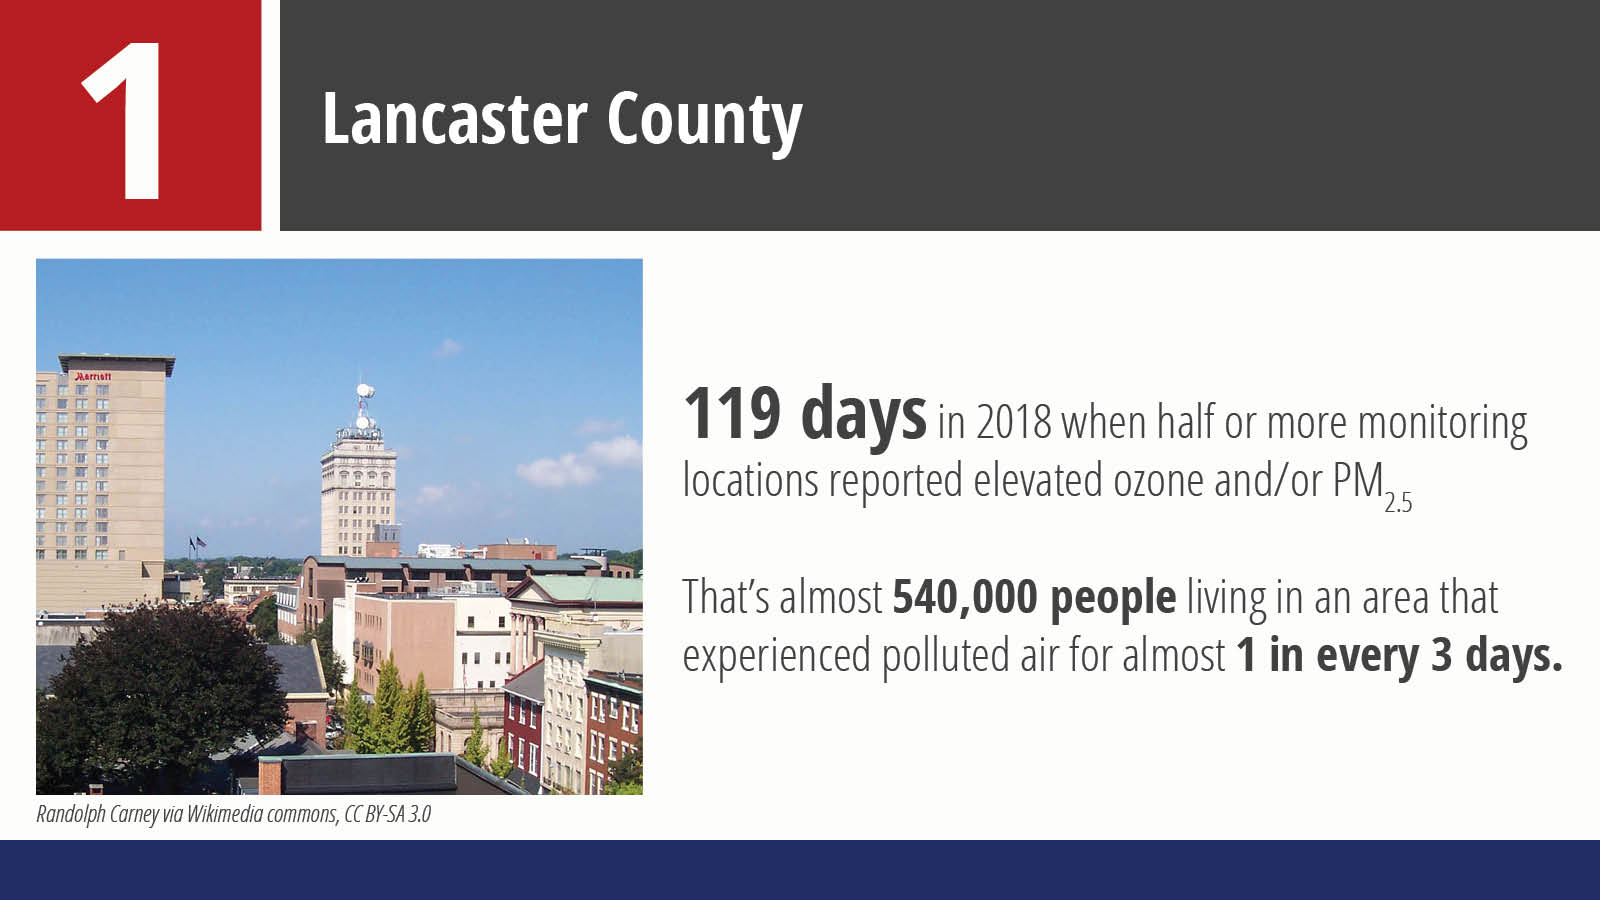
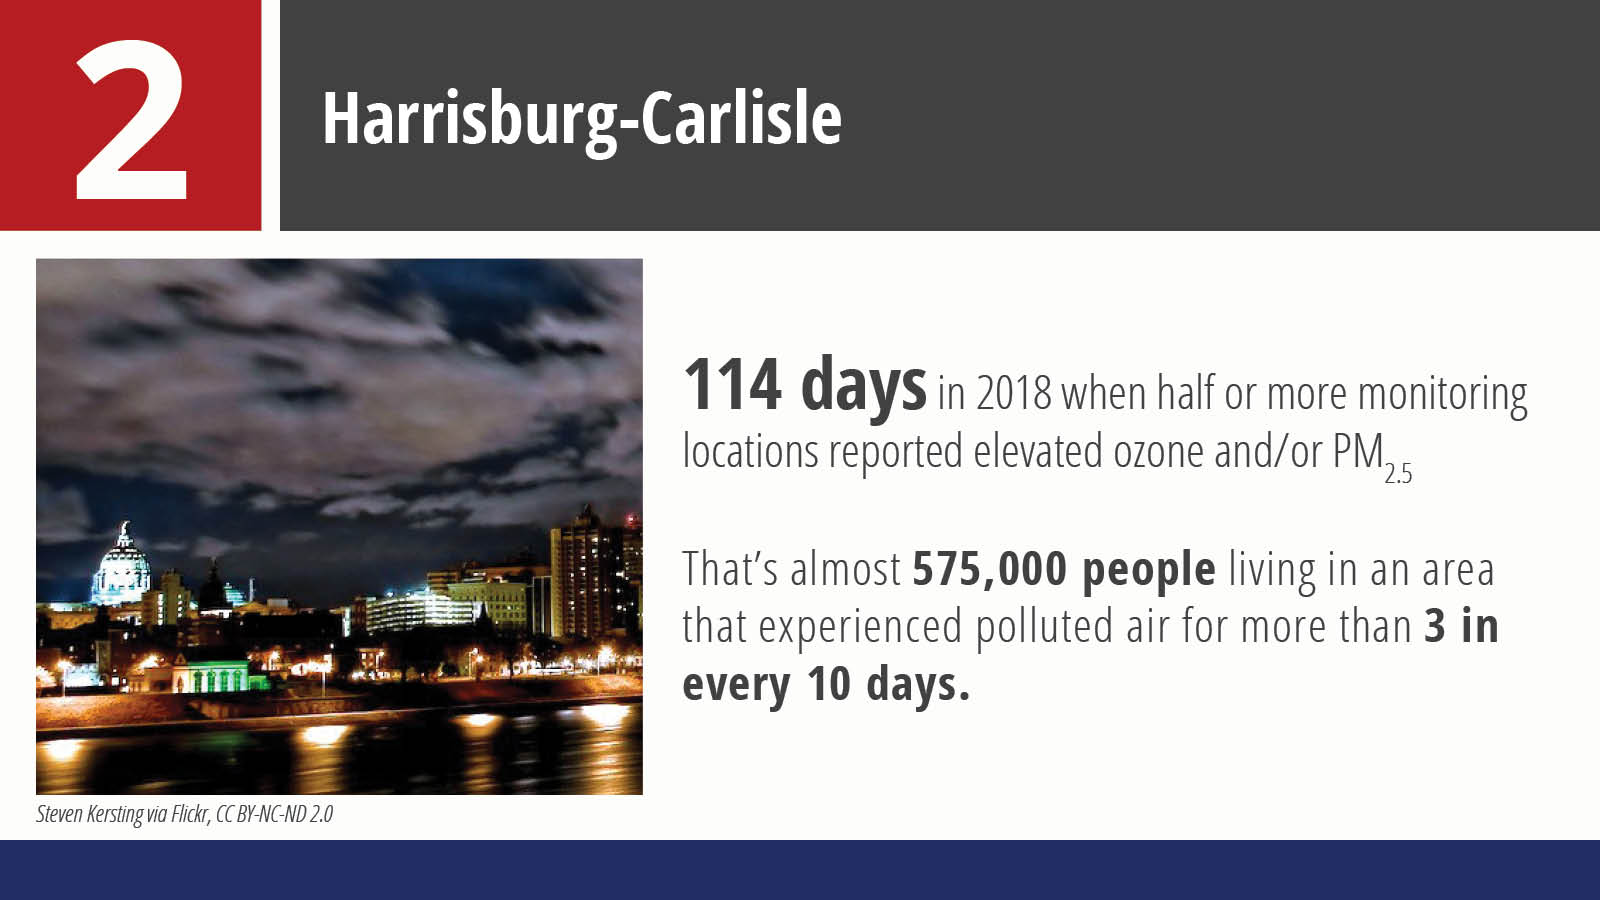
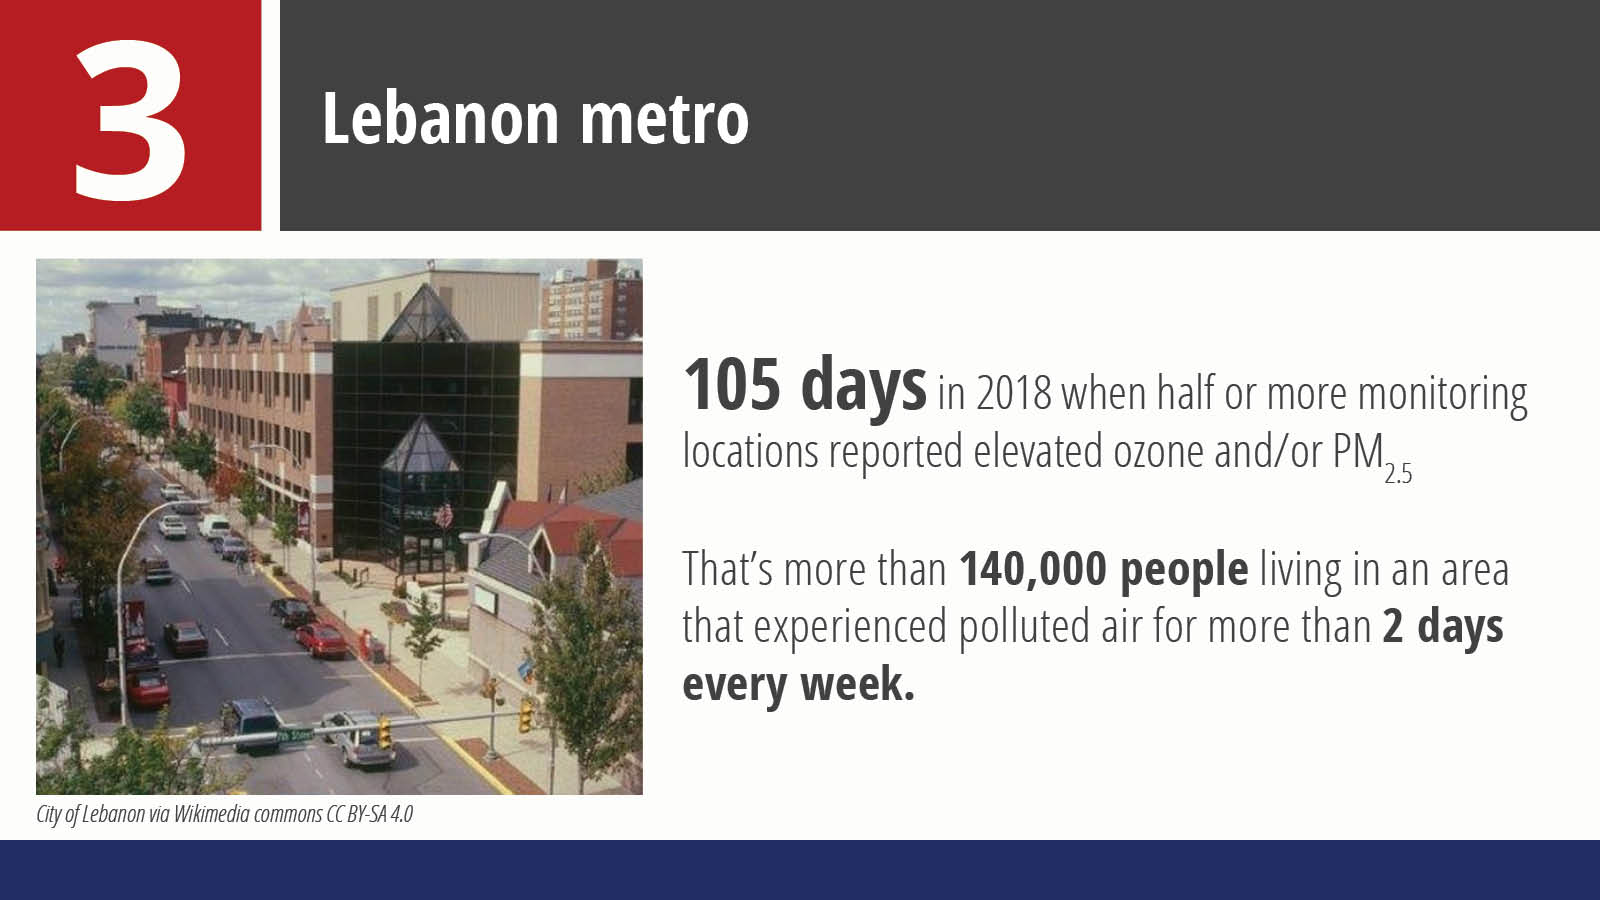
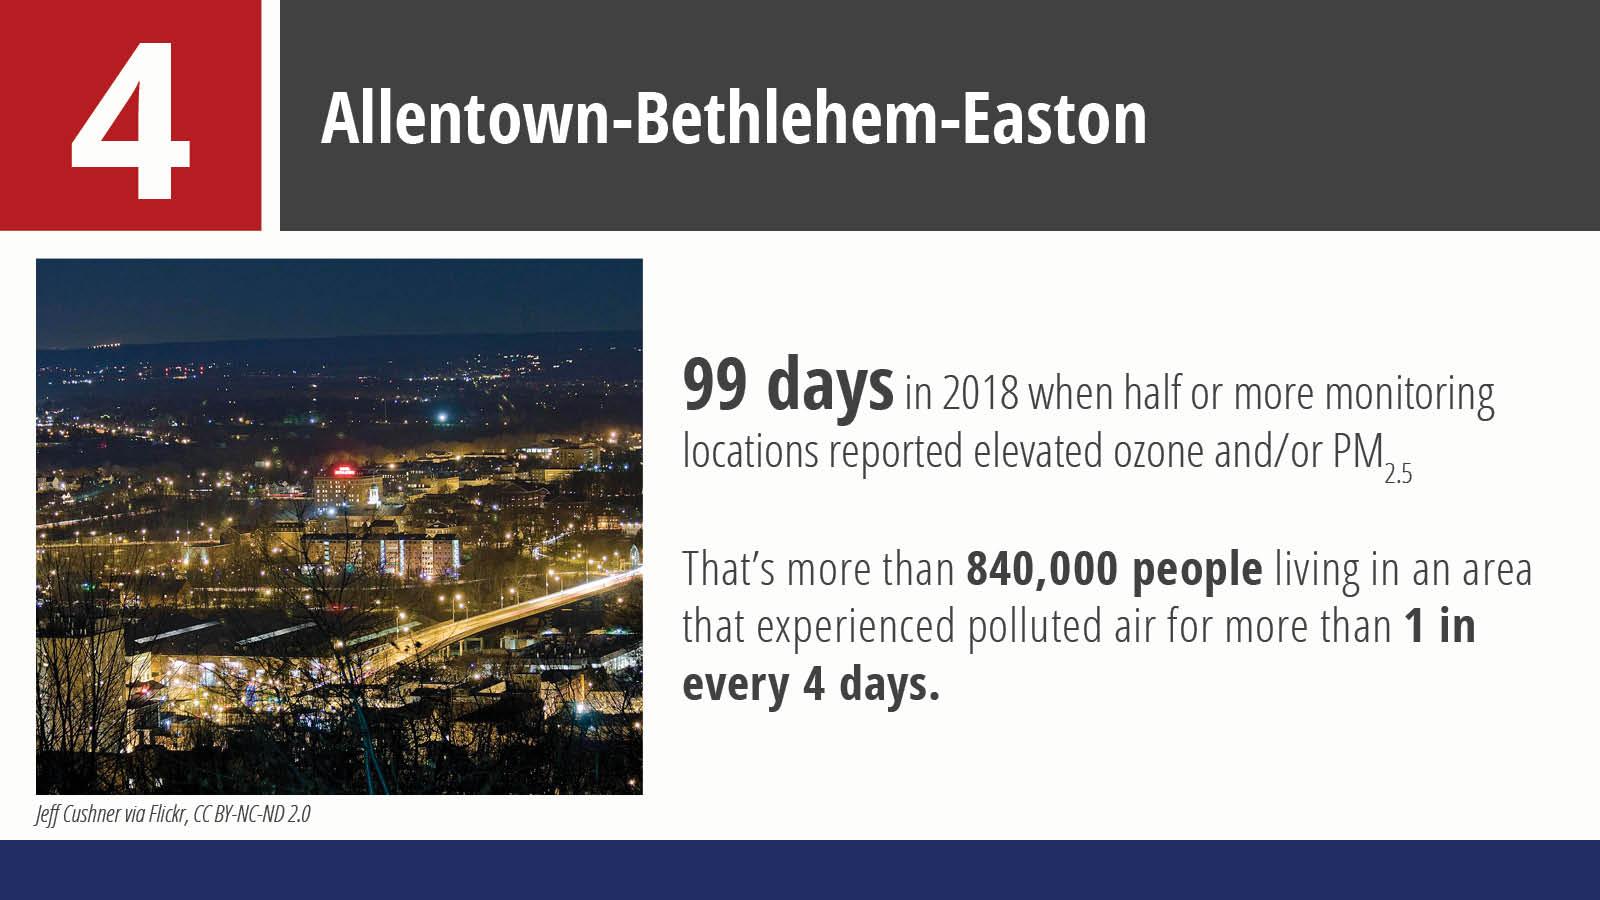
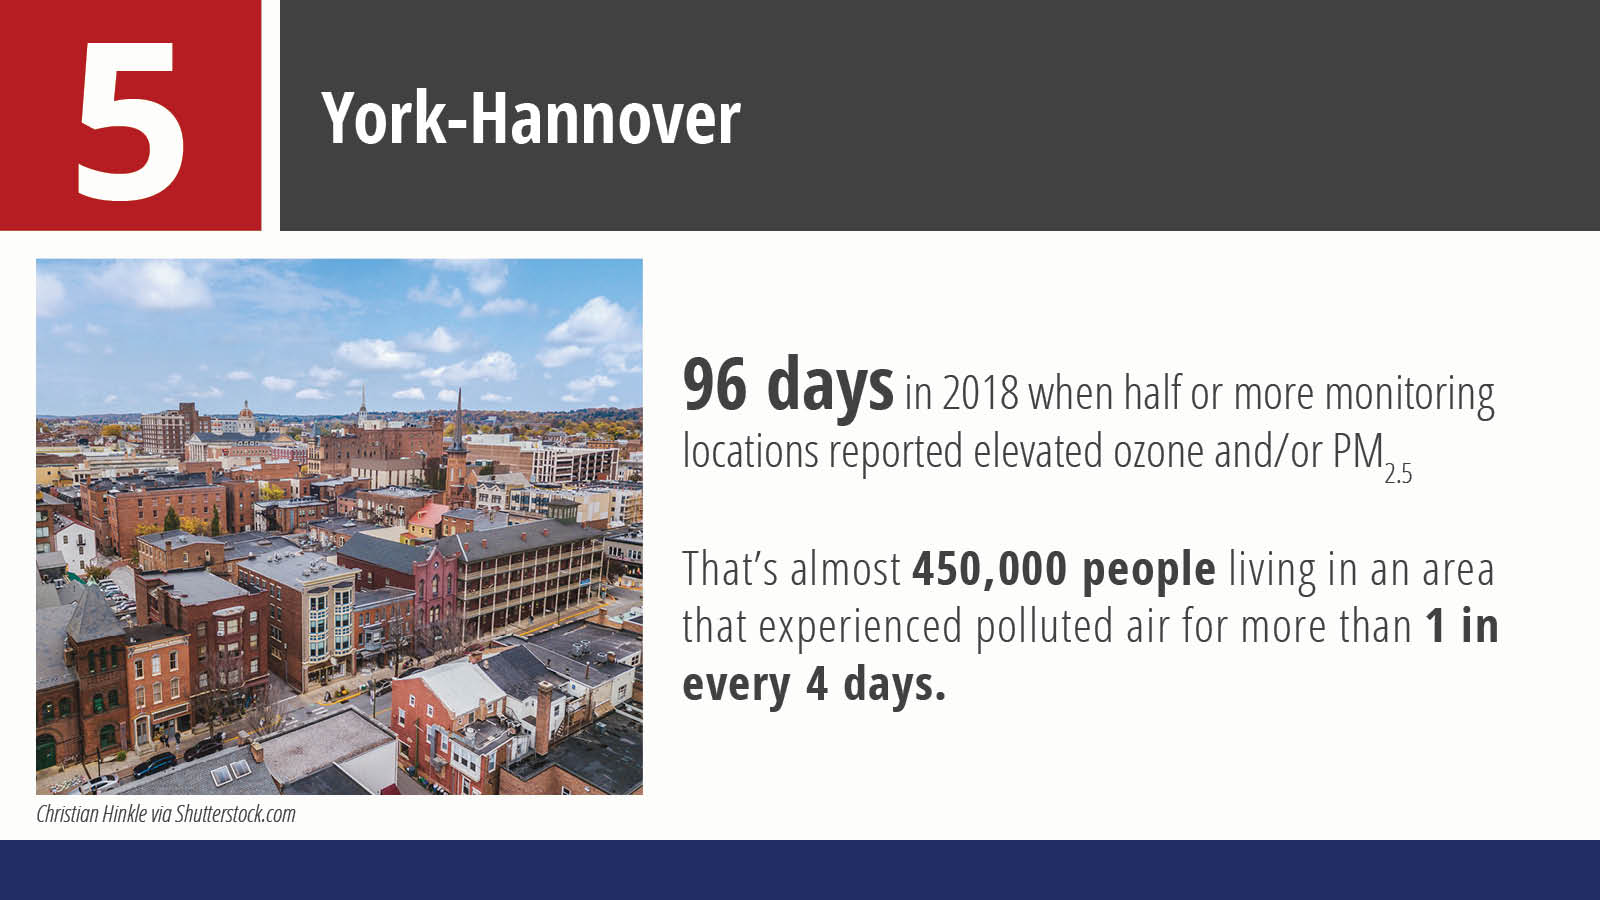
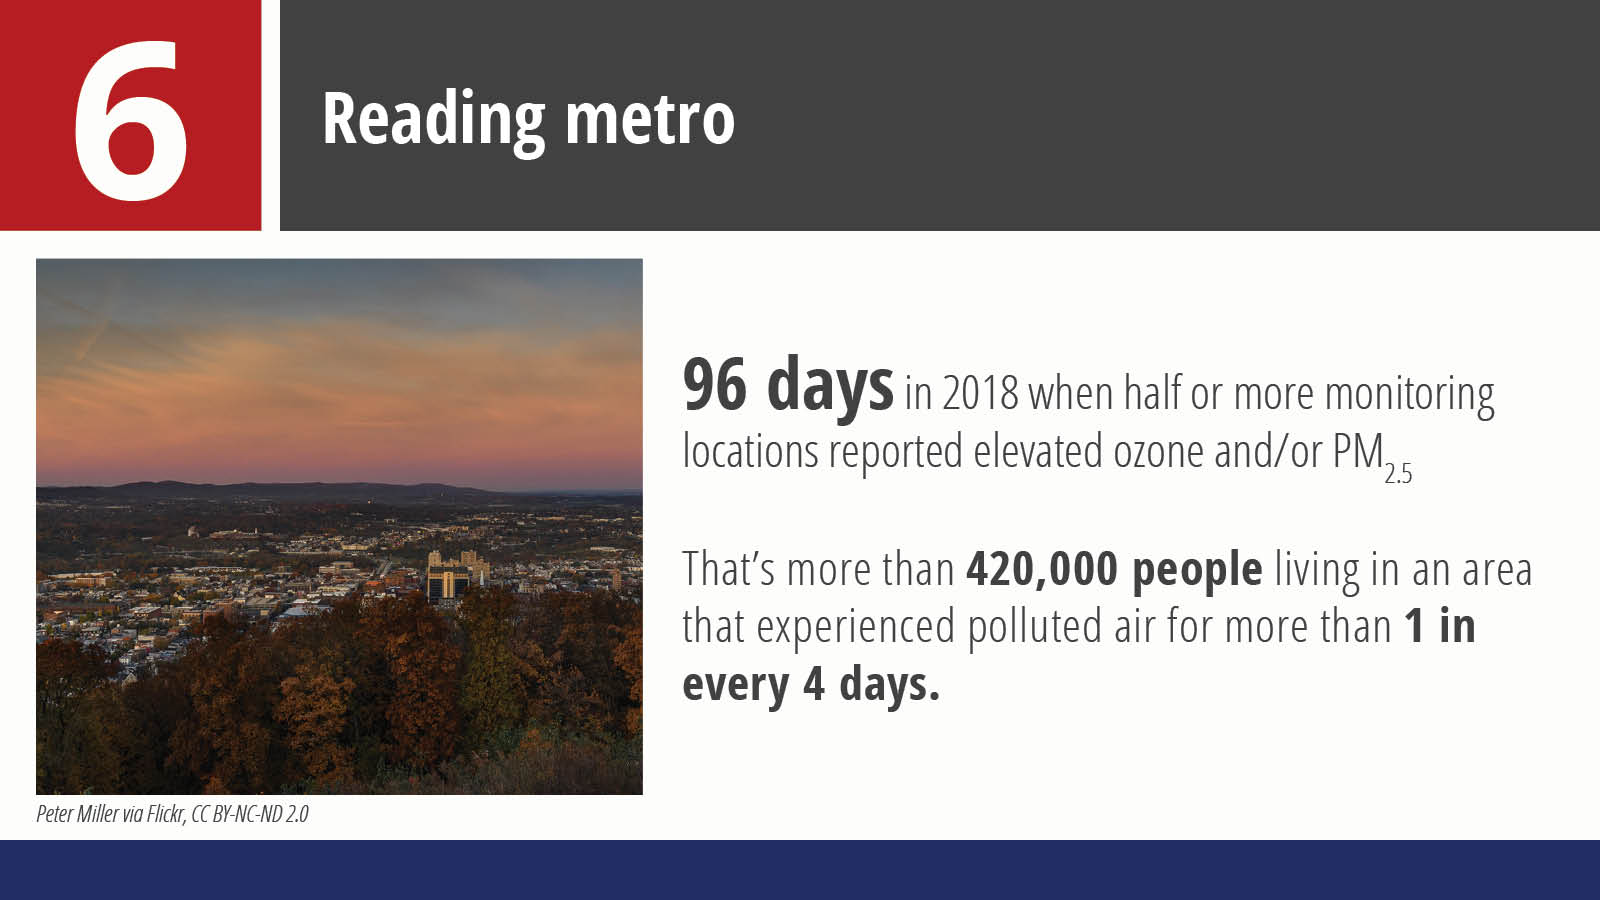
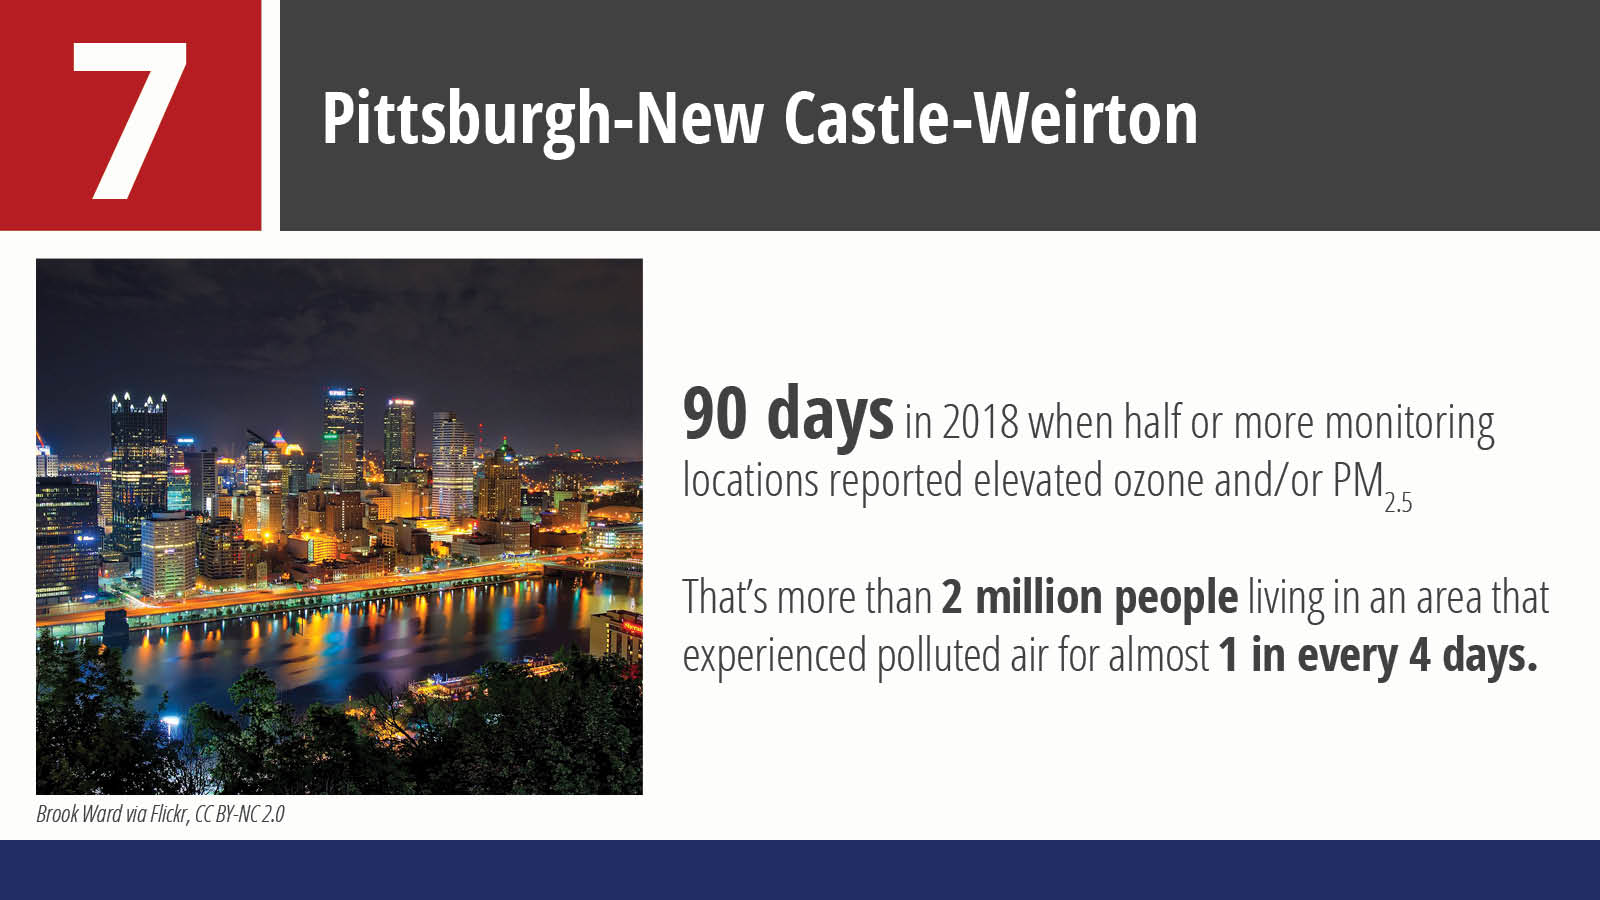
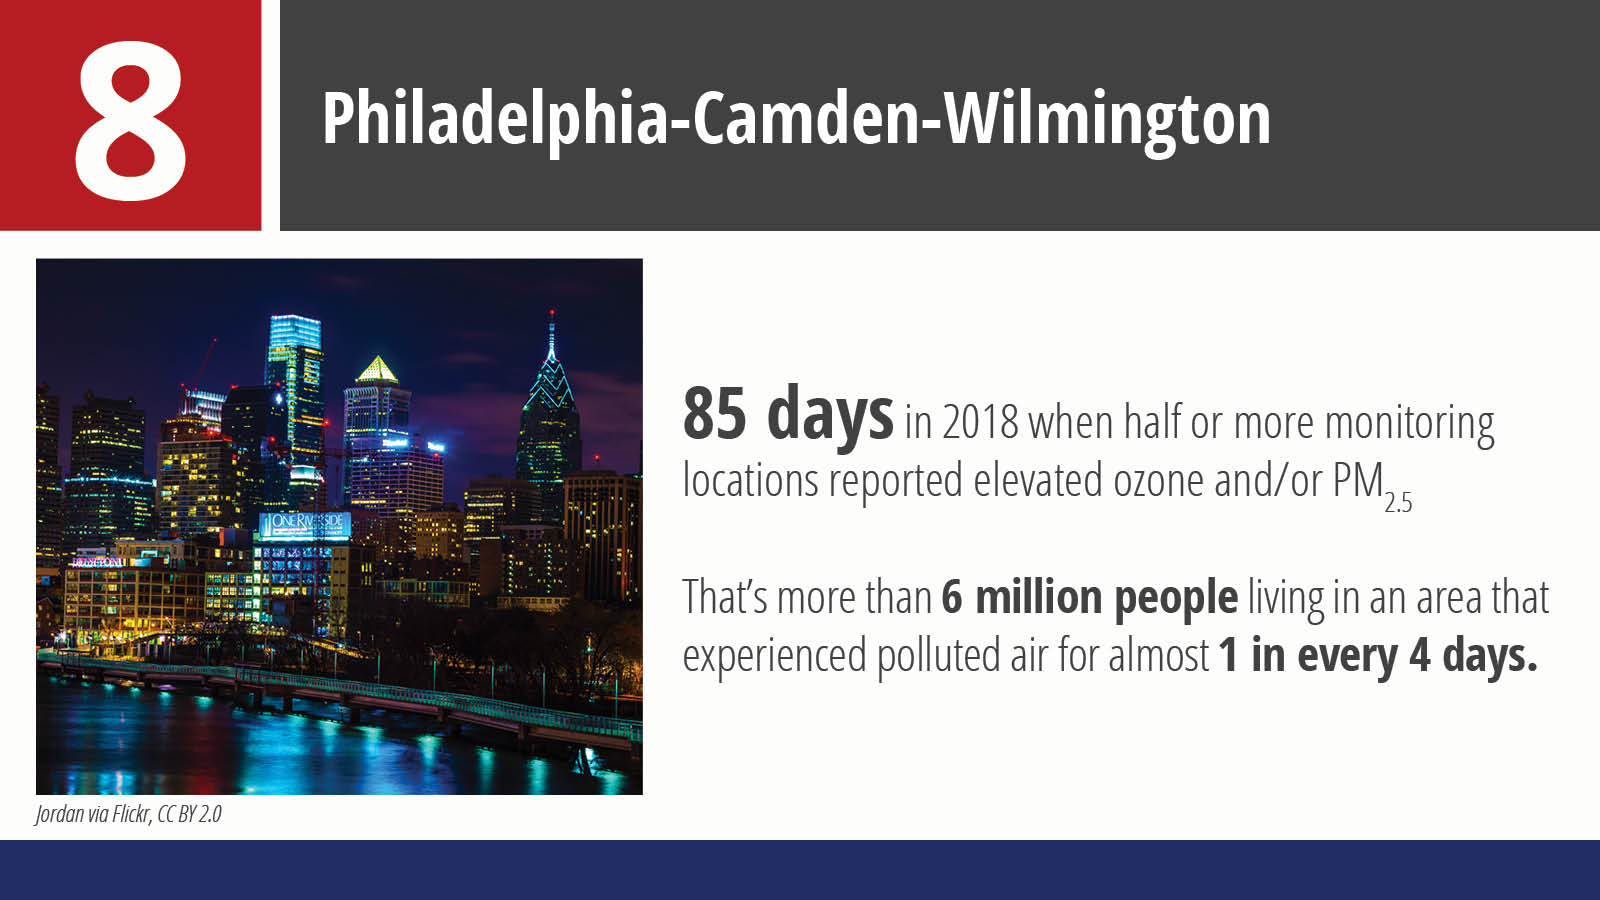
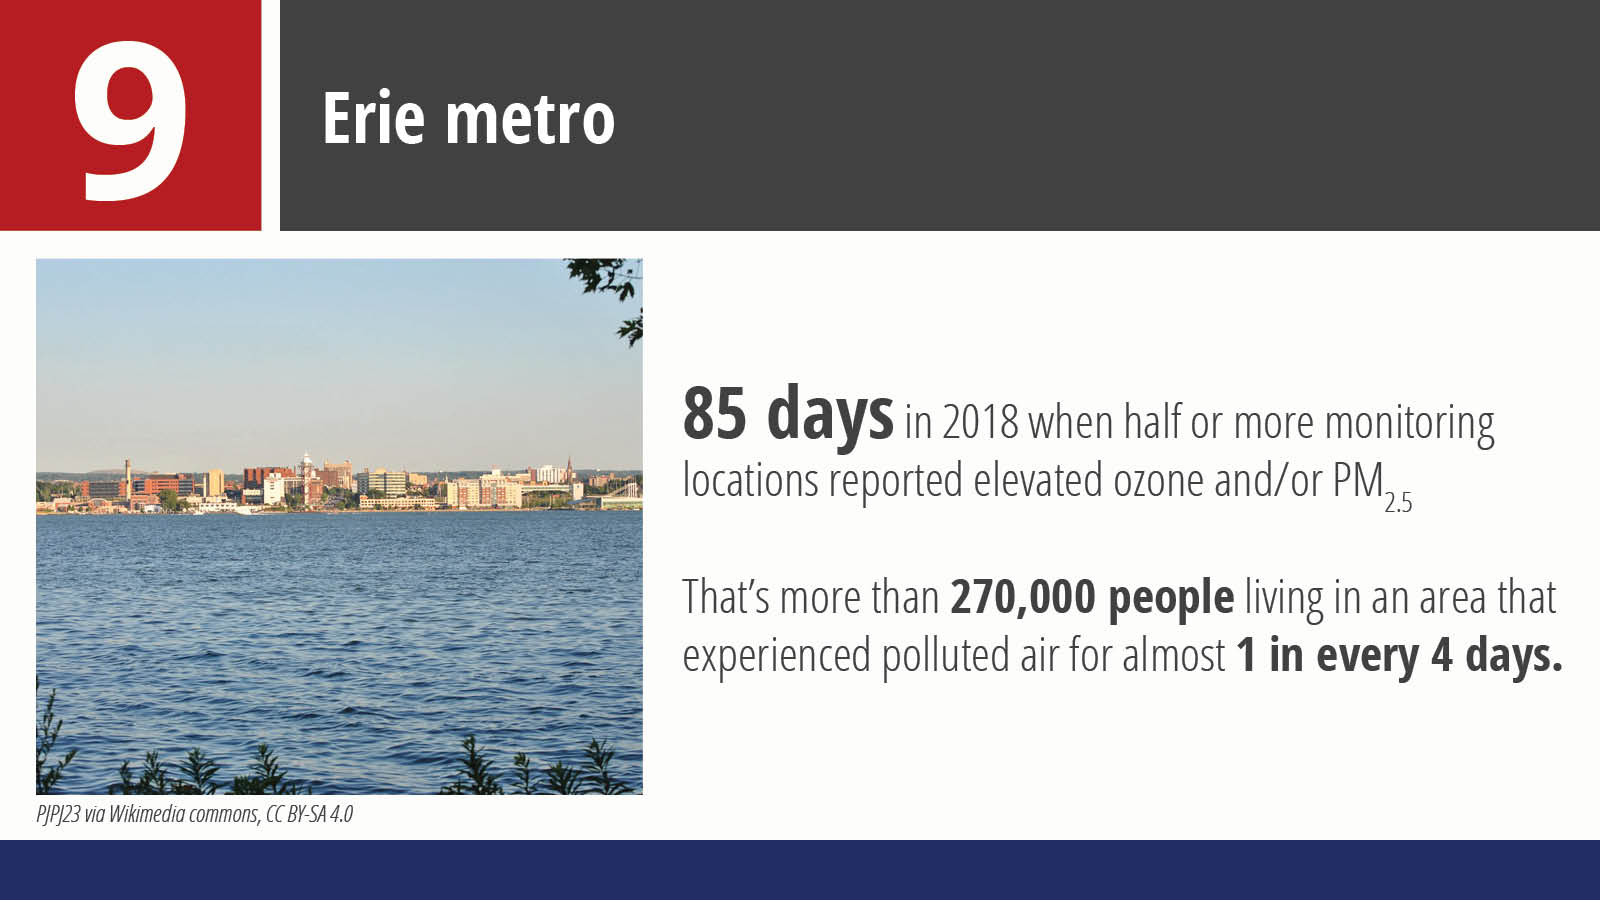
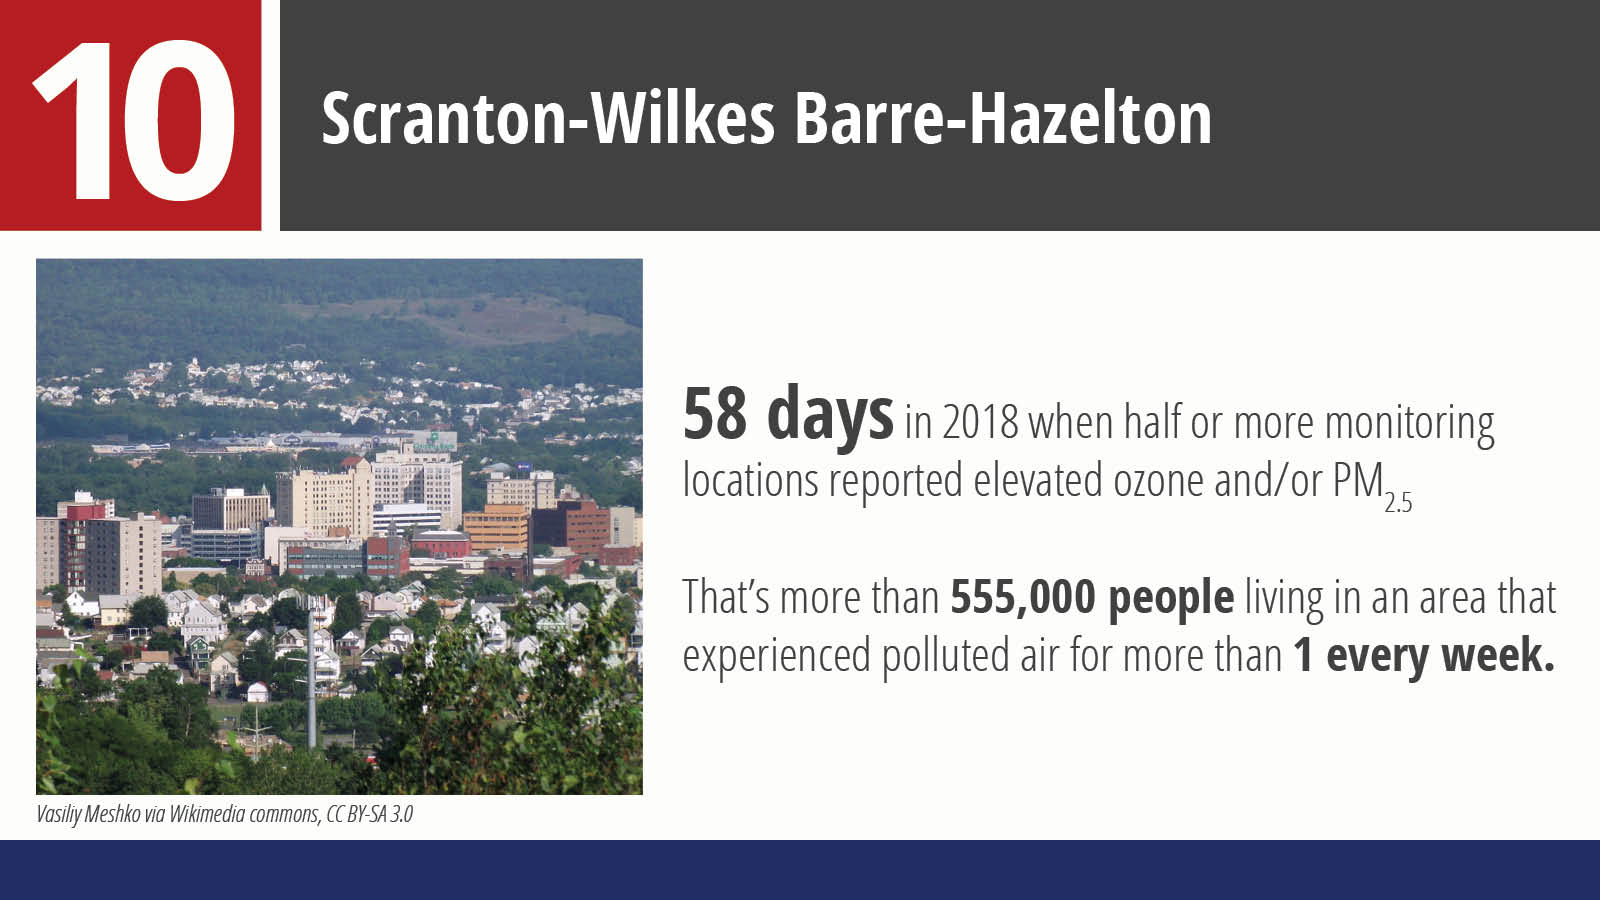
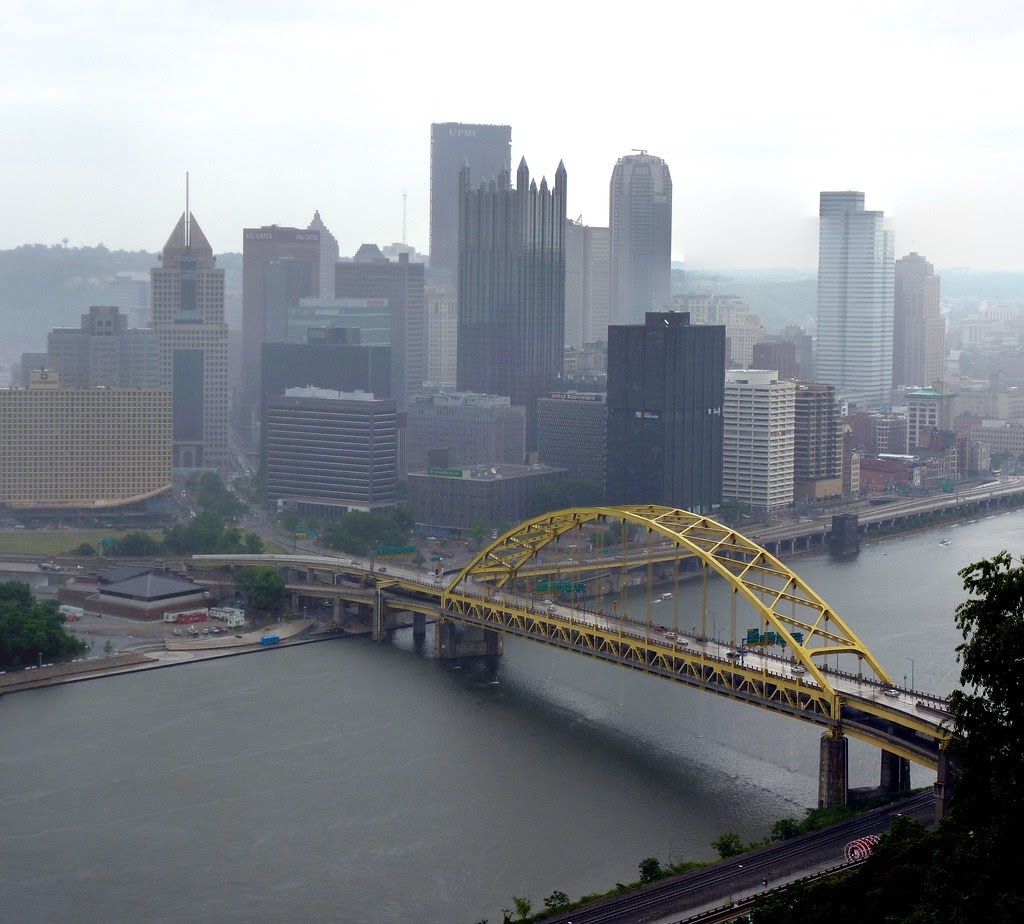
Sadly, most metropolitan areas in Pennsylvania experience elevated levels of air pollution. Below are the 10 most populated metropolitan areas in the state that experienced the most elevated air pollution in 2018.
Air pollution already harms the health of millions of Pennsylvanians and cuts short thousands of lives each year. Climate change will make it worse. The good news is that many of the solutions that address the climate challenge will also improve air quality. Policymakers at the federal, state and local levels should look to implement policies that:
• Reduce emissions from transportation, the largest source of global warming pollution in the U.S. and a major source of air pollution in many communities.9 Policies to reduce global warming and air pollution include expanded use of zero-emission vehicles, regional programs to cap pollution from transportation, and support for active transportation such as walking and biking.
• Support Pennsylvania’s move to join the Regional Greenhouse Gas Initiative and other efforts to move away from fossil fuels — which are a major source of climate pollution in transportation, electricity generation and buildings — and toward the use of clean, renewable energy such as wind turbines and solar panels.
• Clean up Pennsylvania’s dirtiest industrial polluters, including Pittsburgh’s Toxic Ten.
• Strengthen, and strongly enforce, emission and air quality standards to fully protect human health.
•Defend PA’s clean cars program and national CAFE standards from federal attacks